What gets measured, gets managed – Peter Drucker
Data-driven decisions need data. Data that is clean and accurate. In large organizations, the data quality aspect must also be able to execute at scale. There are data challenges across the volume, which are as well significant. Over the years, data has resided in every part of the organization in all shapes and sizes possible. The availability of the accurate and right amount of data significantly impacts decisions from executives to front-line salespersons.
In the first part, we looked into how we can make a list of data sources and build a relationship diagram between different systems. The second part of the blog will look into how the data can be profiled so we can get a better understanding of various data sources and at what quality level they are.
As an analyst, if you have to get your report/dashboard right for your executives, you must build a bunch of little stories around your data. This is where data profiling comes into the picture. The core advantage of data profiling is that it tells you something about your business attributes without getting much deeper into it, record by record.
But before you start profiling your data, you need to understand the context, because if you want your executives to make the right decisions for your organization, you will have to tell them stories the way they understand. For example, Industrial OEMs usually have the following type of data:
- Customer Locations
- Transactional data – Orders
- Assets
- Services
- Service Contracts
- Warranties
- Product Catalog
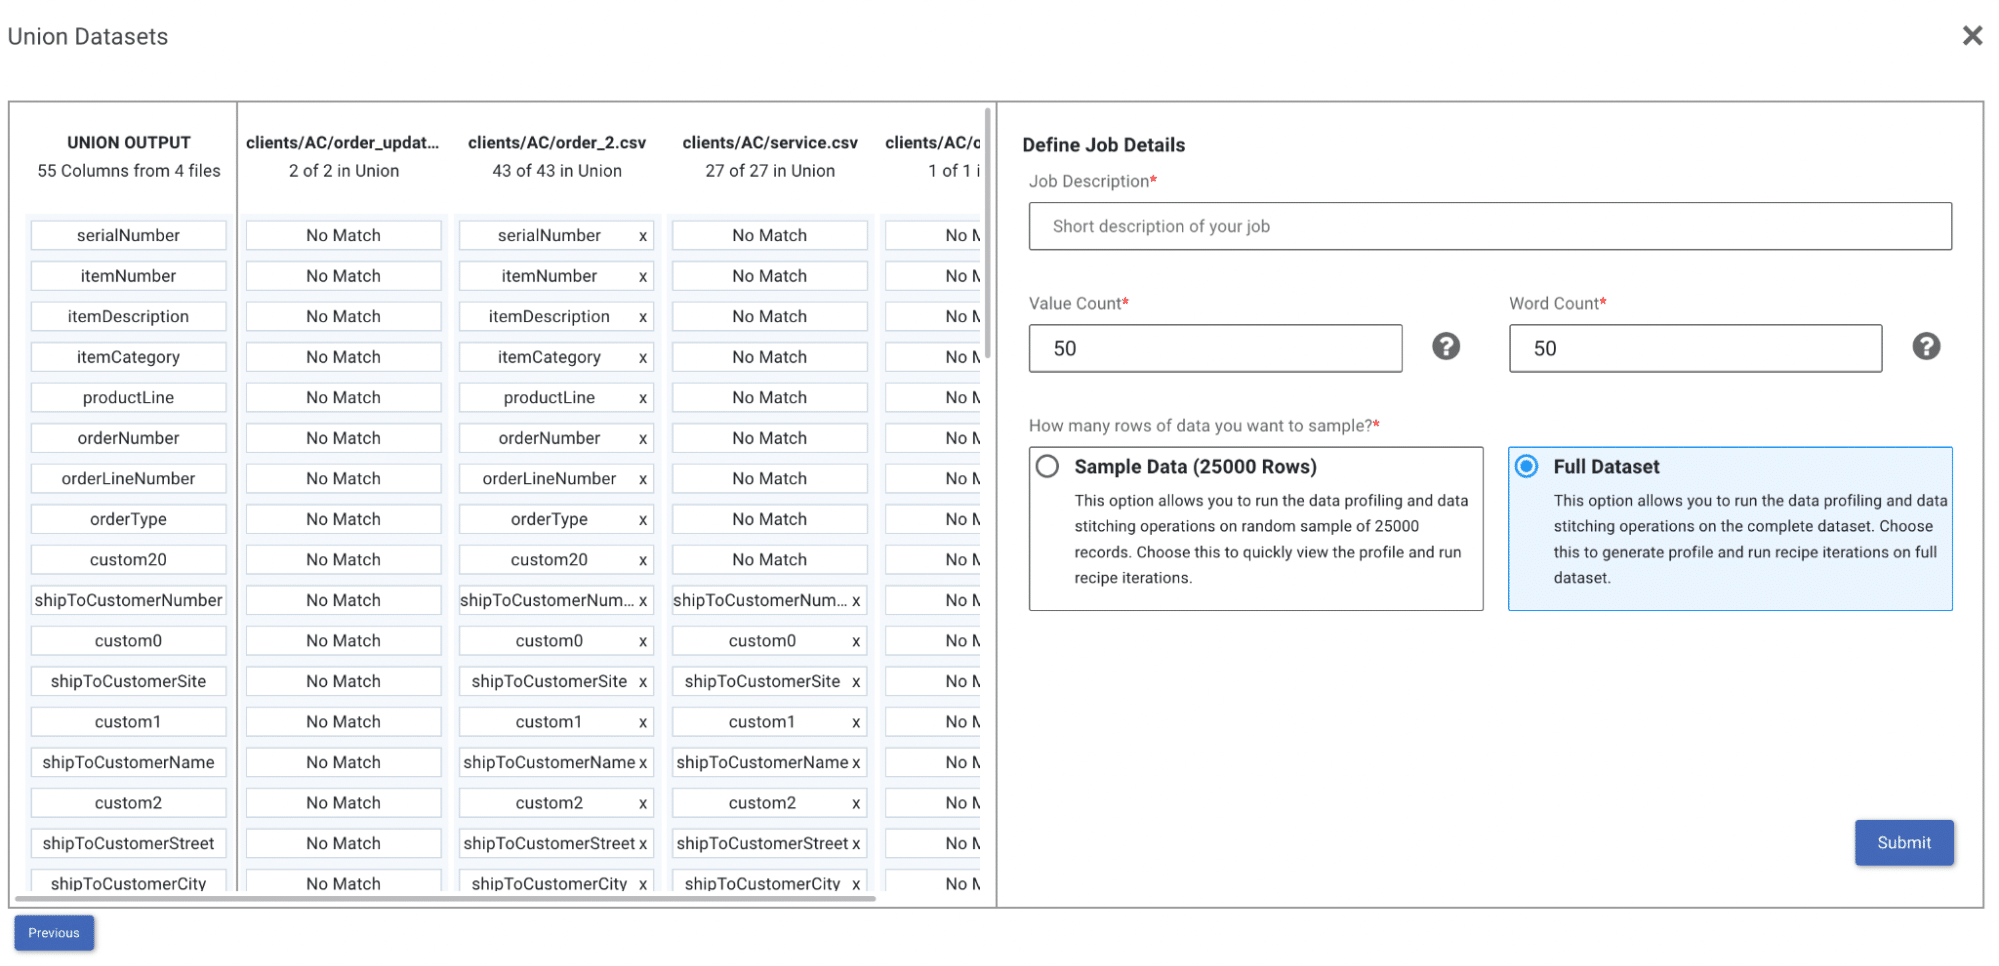
For manufacturers, having an Installed Base of 10K locations and 100K parts and equipment over a period of time, the transactional data would be huge enough to make it impossible to review it record by record. In the real world, all this data would reside in different tools, and spreadsheets and some data may not even exist. So at Entytle, we built a data profiling tool that allows you to merge different files into one and view all data in a single place. As shown in the image below, you can choose 5 different files, merge all of them together and generate a profile of the merged dataset.
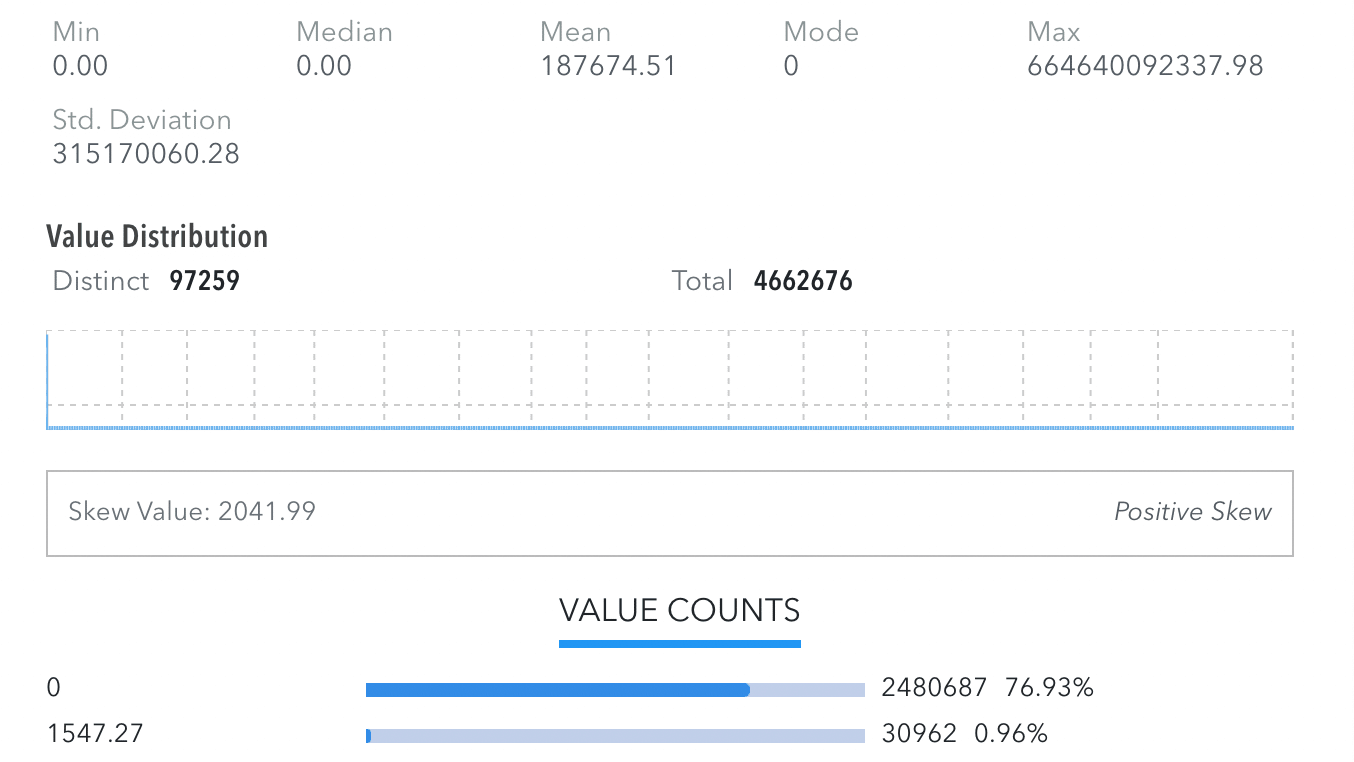
Once the profile report is generated, it becomes easier to gauge the quality of the data. You must look for features like Cardinality, Missing Values, Patterns, Outliers, Median values, and Min and Max values in the dataset to gauge its quality. Datasets with tremendous outlier values or missing values would be the obvious ones to drag your data quality down. For example, a dataset having $600Bn of [orderAmount], as shown in the image below, is a huge outlier. If accurate, it could change the fortunes of the manufacturer! One more outlier is 70% of the dataset has a Zero [orderAmount] value. These are just a few examples, but the crux of the matter is, with this data level of quality, it would be impossible for your executives to plan strategies that are in sync with the Installed Base value.
Finally, data cleansing and enrichment include identifying, modifying, or removing any data from your dataset that is incomplete, incorrect, or irrelevant. This is where profiling helps. Moreover, with different types of objects mentioned above (Location, transactions, etc.), the quality metrics differ. There are tons of profiling tools out in the market, but we at Entytle, have built an end-to-end platform that helps you ingest, profile, clean, and unify your data keeping your Installed Base Models at the heart of it. It eventually would help you realize the actual value of your Installed Base. For more information, talk to us at info@entytle.com or contact us.
[ux_slider]
[section bg_color=”rgb(240, 240, 240)” padding=”20px” height=”300px” video_visibility=”visible”]
[ux_text font_size=”1.25″ text_align=”center”]
Read Previous Blog:
[/ux_text]
[row style=”large” v_align=”middle” h_align=”center”]
[col span=”6″ span__sm=”12″ padding=”15px 15px 15px 15px” bg_color=”rgb(255, 255, 255)” depth=”2″ depth_hover=”5″]
[ux_image id=”20753″ image_size=”original” link=”https://entytle.com/blogs/steps-to-fix-installed-base-data-for-installed-base-selling-part-1/”]
[/col]
[col span=”6″ span__sm=”12″ align=”center”]
Steps to fix Installed Base Data for Installed Base Selling – Part 1/4
[/col]
[/row]
[/section]
[/ux_slider]
[gap height=”50px”]